First results presented at the AGU 2022 Fall Meeting
Can you believe it’s been six months since the project launched already?!
While you’ve been hard at work helping to complete the first Mars year (MY) of data that’s been uploaded so far (MY29), we’ve been processing and analyzing the results. Last month, I had the opportunity to present some of the first findings at the American Geophysical Union’s (AGU) 2022 Fall Meeting in Chicago. I described the project, showed how participant’s marks are clustered together to get cloud locations, and discussed a few preliminary findings (we still have work to do to flesh these out!). Here, I’ll walk through those findings.
Day-to-night variation from atmospheric thermal tides
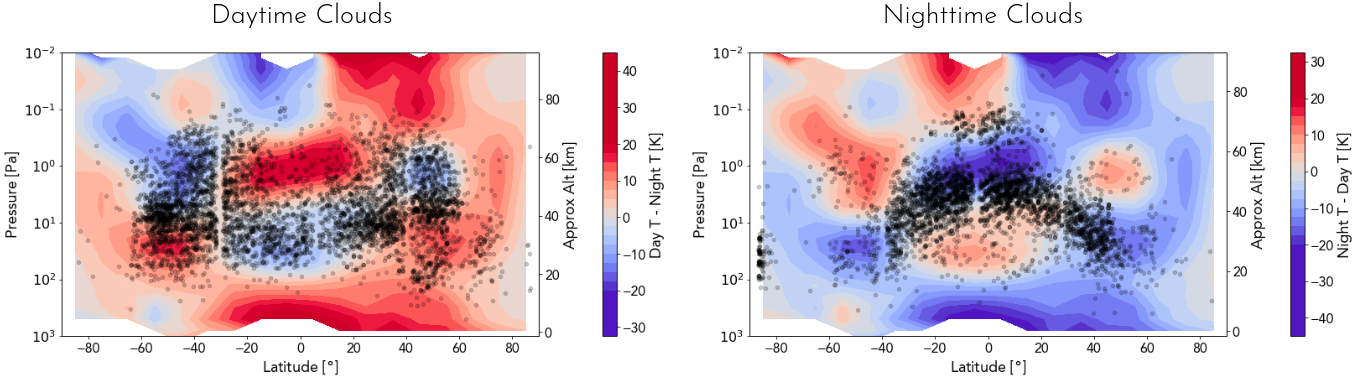
What are thermal tides? They’re large (global-scale) patterns in, for instance, the temperature or pressure of the atmosphere due to the cycle of heating from the sun. The sun heats the planet and the atmosphere during the day, but not at night. Because the instrument used in the Cloudspotting on Mars, Mars Climate Sounder, measures temperature at 3PM and 3AM, we can compare cloud locations with temperatures to see the effect of the diurnal tide (one minimum and one maximum) on cloud formation. Below are two plots—one for 3PM and one for 3AM—that show the change in temperatures between 3PM and 3AM (footnote).
In the daytime plot, the red regions indicate where the daytime is warmer than the nightside and the blue is where the daytime is cooler than the nightside (white and gray colors indicate roughly equal temperatures). The dots show individual clouds identified through the Cloudspotting on Mars project. The horizontal axis is latitude—we’ve averaged across all longitudes—and the vertical axis is altitude. You can see that between 20 km and 40 km clouds form near the equator (Latitude of 0 degrees) in the large cold region. Above 40 km, there is a warm region and few clouds are observed. As you go north or south, the clouds tend to follow the tidal pattern, meaning they follow the cold blue regions up to about 60 degrees N and 60 degrees S.
In the nighttime plot, the colors show the daytime temperature subtracted from the nighttime temperature, so the warm nighttime regions are red and the cold nighttime regions are blue. Around the equator, the clouds are higher than during the daytime because the cold phase of the tide is higher. And at higher latitudes (more south and more north), the clouds decrease in altitude following the tidal pattern. Pretty neat!
A jump in cloud altitudes due to dust storms
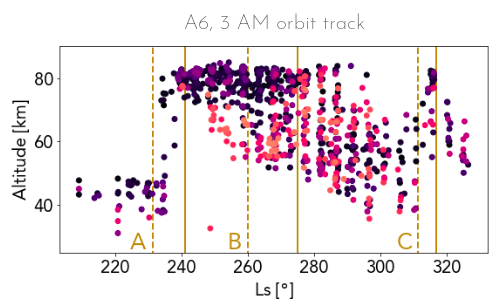
Dust has a strong influence on the martian climate. There are typically three distinct regional-scale dust storms—with areas as large as Alaska or even continents—that occur on Mars, labeled the A, B, and C storms, which significantly increase temperatures in the middle atmosphere. The figure below shows how those storms, in MY29, affected the altitudes of clouds. The individual dots are clouds identified through the project that formed in the southern hemisphere (brighter colors are closer to the pole, darker closer to the equator). The dashed lines show when the storms began (the horizontal axis is solar longitude or “L sub s”) and the solid lines show the peaks of the storms. Before the A-storm, clouds are seen around 40 km, but by the peak of the A storm, over a short period of time, the altitudes are closer to 80 km. That’s a big difference! As the B-storm decays and the atmosphere cools, the clouds move lower in the atmosphere. But after the onset of the C-storm, they quickly increase again. Dust storms heat and puff up the atmosphere. This can allow water vapor to reach high altitudes where it can be broken apart and eventually lost to space. Seeing where these clouds form could inform us as to how water is transported through the atmosphere during dust storms.
See you at the next webinar!
-Marek