
And what a launch it was!
Wow! I was really taken aback by the number of people that participated in the project from the get-go. Over 2000 classifications were made in just several hours, 7000 just twelve hours in, and over 15,000 on the second day. After those first few days over 1000 registered Zooniverse users had participated (not all participants register for a Zooniverse account, you can navigate to a project and immediately start classifying). On the third day, the entire first set of data (I’ll explain more about the subject sets later in the post) had been retired! We require 20 participants to classify each subject (a subject is just one image that you look for arches in, each subject has four frames that you search through) before it is retired and that set contained 2112 subjects, which means we were over 42,000 classifications in only a few days. Not to mention the activity on the Talk board – several hundred comments during the first few days of volunteers saying hello, asking questions about Mars, and discussing the details of specific images.
One week into the project, 95,000 classifications had been made and the second set was retired. Two weeks after launch over 2000 registered users had participated and all three sets (over 120,000 classifications) we had hoped to have analyzed were completed. We expected it to take at least two months for participants to analyze all that data. I’m in awe at you all accomplished and extremely grateful that so many human beings were motivated to sit down and work on this project whether it was for just a few minutes or many hours. Thank you, sincerely!
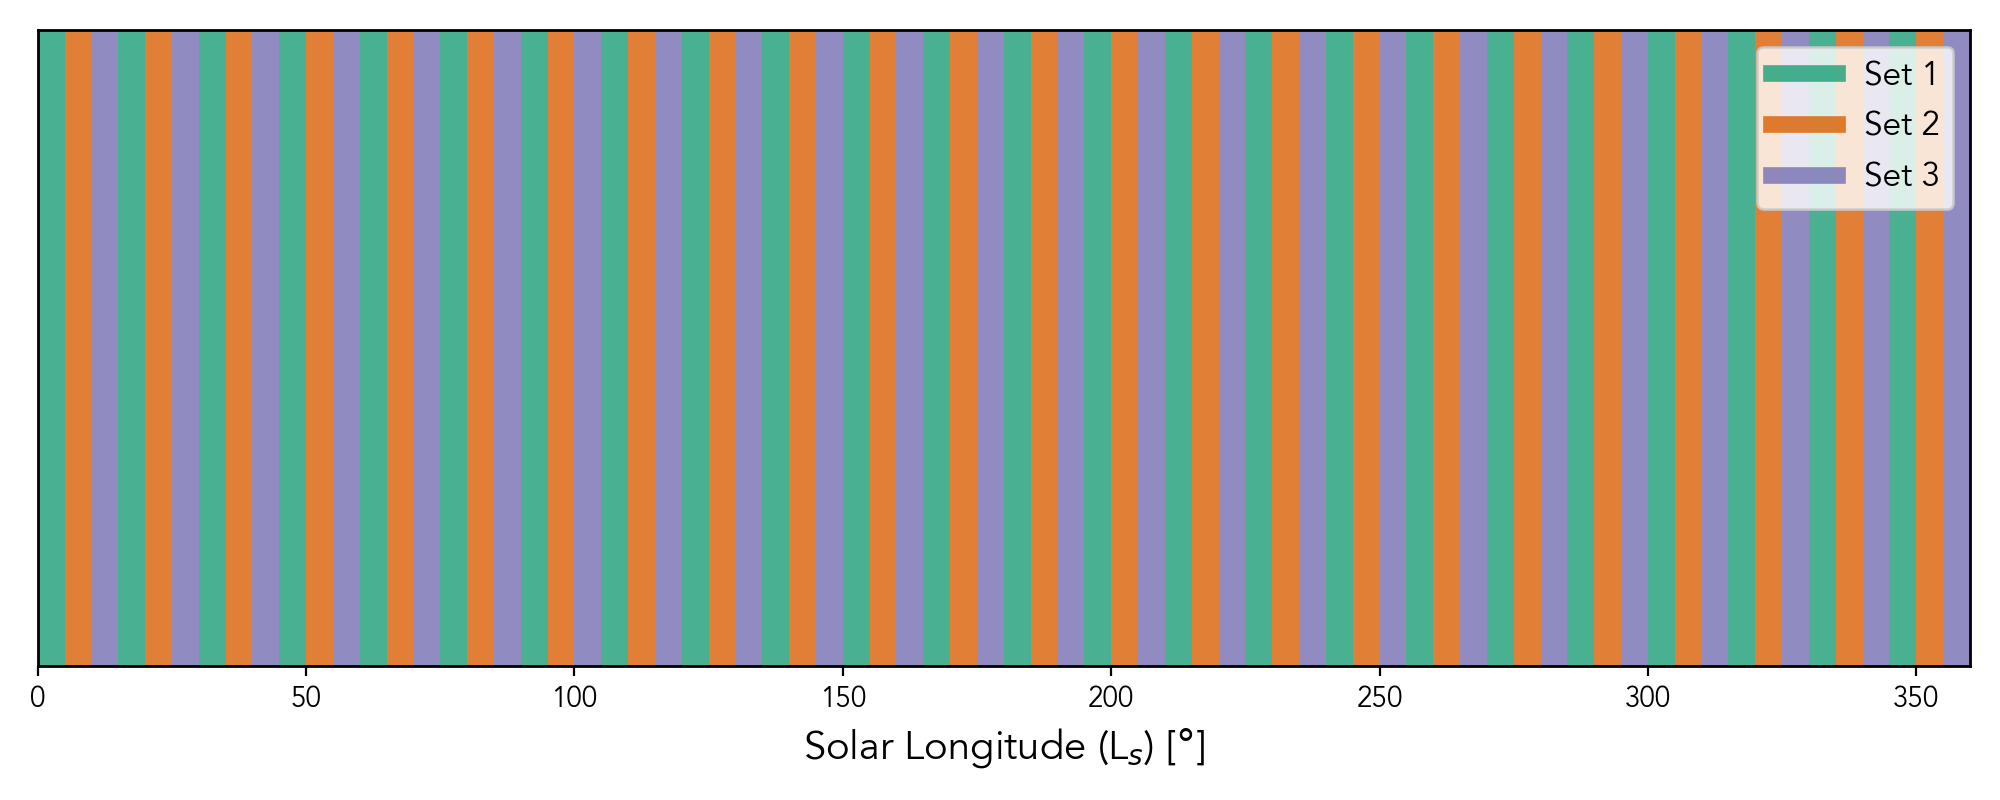
So what were those three data sets? Well, we wanted to make sure that we had volunteers get through sets that were representative of an entire Mars year. So, first we split Mars Year 29 (MY29, an explainer of Mars timekeeping) into 24 periods (essentially, half a Martian month). Each of the three sets sample from each of those 24 periods so that they all cover the full Mars year. And we subdivided each of those into 3 small chunks, so the first set is always the beginning of a period, the second is the middle, and the third the end. This shows you how the time is broken up (in Ls, pronounced “L sub ess”) between the three sets:
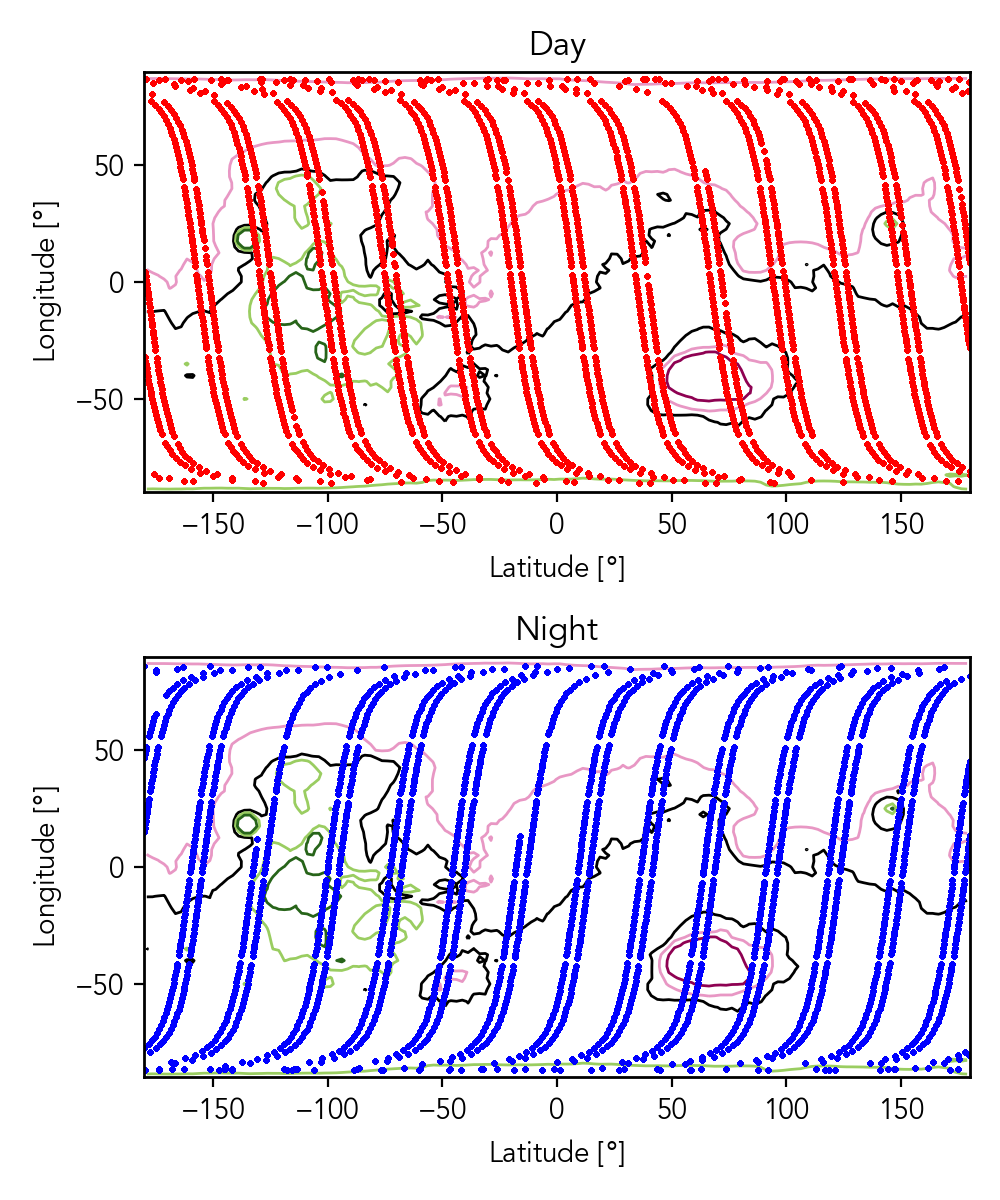
Now, we wanted to make sure that in each subset of time, we chose measurements that covered the entire planet (both during the day and at night). MRO, the spacecraft which MCS is on, orbits Mars once every few hours, so MCS sees about 12-13 longitudes every day. We chose to use 2 consecutive days of observations, to cover the globe. That amounts to 12 4-hour files (MCS files are organized in 4-hour chunks). The figure below shows what the coverage looks like. The points are where the locations MCS observes, and the lines in the background show the topography on Mars (dark green is high elevation, pink is low). You can see that over 48 hours we build up a snapshot of the whole planet.
Because those three sets have all been retired, we decided to release all the remaining data in MY29. That’s right, all the gaps between each set, throughout the whole year, we’re now shooting to analyze all of it. So if you’ve enjoyed the project so far, please check out the project page again and help us spot more clouds!
I really enjoyed meeting several of you at the first webinar. We’ll try to get the recording posted soon and we’ll let you know when we’ve set a data for another one this month (Aug 2022). If you have any questions, don’t hesitate to reach out on the Zooniverse Talk boards or by email at cloudspottingonmars@gmail.com.
And check out this awesome story about the project in WIRED!!!
-Marek